
Key metrics every operations manager should track fall into a handful of categories: speed, quality, cost, and customer impact, and once you know which metric belongs in which bucket, building a dashboard stops feeling overwhelming. Because operations spans so many functions, from warehousing to customer service to production, it is tempting to track everything. However, tracking too much dilutes attention from the handful of numbers that actually predict trouble before it becomes a crisis.
Why Metrics Matter More Than Gut Feel
Operations decisions made purely on instinct tend to react to the most recent complaint rather than the biggest actual problem. For example, a single angry customer email can trigger a process overhaul, while a quietly worsening on-time delivery rate goes unnoticed because no one is shouting about it yet. Because metrics surface patterns that individual anecdotes hide, they let you prioritize fixes based on scale and trend instead of whoever complained loudest this week.
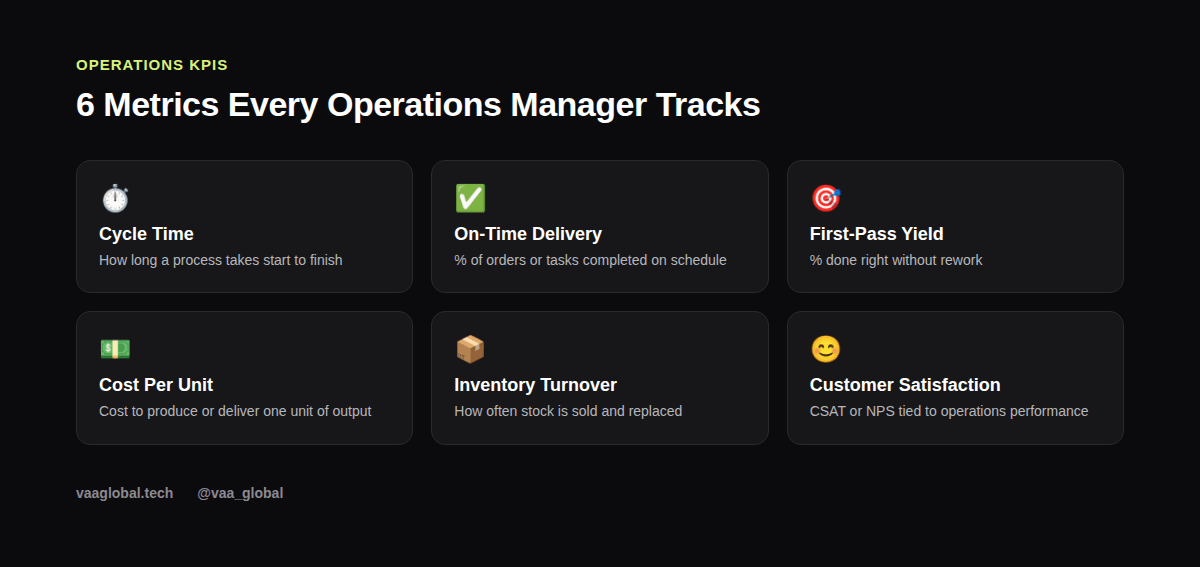
Cycle Time: The Clock On Every Process
Cycle time measures how long a process takes from start to finish, whether that is order to delivery, application to approval, or ticket to resolution. Tracking it over time reveals whether recent changes actually sped things up or just felt like they did. A useful habit is breaking cycle time into stages, since a single average number can hide one slow stage that is dragging the whole process down while the rest run fine.
On-Time Delivery Rate And Why It's Non-Negotiable
On-time delivery rate is one of the most visible operations KPIs because customers notice it directly, even when they never see your internal dashboards. A drop from 95% to 88% might look small on paper, but it often means a specific bottleneck, such as a single unreliable supplier or an understaffed shift, and it deserves immediate root-cause investigation rather than a vague "let's try harder" response.
First-Pass Yield And Quality Metrics
First-pass yield tracks the percentage of work completed correctly the first time, without rework, returns, or corrections. This matters because rework is expensive in ways that do not always show up clearly in a budget line item; it consumes extra labor hours, delays everything behind it in the queue, and often damages trust with whoever is waiting on the output. If first-pass yield is falling, it is usually a training, process clarity, or tooling issue, rarely a motivation issue, so investigate accordingly.
Cost Per Unit And Resource Efficiency
Cost per unit tells you how efficiently resources convert into output, whether "unit" means a product, an order, or a service ticket. Tracking this over time, rather than as a single snapshot, shows whether process changes are actually saving money or just shifting cost somewhere else, for instance reducing labor cost while quietly increasing error rates and returns. A rigorous approach to cost tracking borrows heavily from standard cost-accounting practices; the overview of cost accounting from Investopedia is a solid primer if this is new territory for you.
Inventory Turnover For Product And Supply-Heavy Teams
Inventory turnover measures how often stock is sold and replaced over a given period, and it matters because both extremes are costly. Low turnover ties up cash in unsold inventory and increases the risk of obsolescence, while turnover that is too high can signal chronic stockouts and lost sales. If supply chain metrics are new to you, supply chain management explained and supply chain vs logistics difference both offer useful grounding before you build out this part of your dashboard.
Customer Satisfaction As An Operations Metric
It is easy to think of customer satisfaction as a marketing or support metric, but operations drives a huge share of it. Late deliveries, order errors, and slow issue resolution are almost always operational failures wearing a customer-service costume. Tracking a CSAT or Net Promoter Score alongside your internal operations KPIs closes the loop between what your dashboards say and what customers actually experience, which keeps the whole metrics exercise honest.
How To Build A Simple Operations Dashboard
Start with no more than 5-7 metrics, each with a clear owner, a target, and a review cadence. Weekly reviews work well for cycle time and delivery metrics, since they shift quickly, while monthly reviews suit cost and inventory metrics that move more slowly. Many of the tools used for this kind of tracking are covered in operations management tools and software beginners should know, which is a good next read once you know which metrics matter to your team specifically.
Reporting Metrics To Leadership Without Losing Them
When reporting operations metrics to leadership, lead with the trend and the business impact, not the raw number. Instead of "cycle time is 4.2 days," try "cycle time dropped from 5.1 to 4.2 days after we changed the approval process, saving roughly 900 labor hours this quarter." If you want to build a deeper foundation in this skill set, VAA Global's operations management course covers process design, financial operations, and technology in operations across a structured ten-week program.
Setting A Benchmark And Reading Your Dashboard
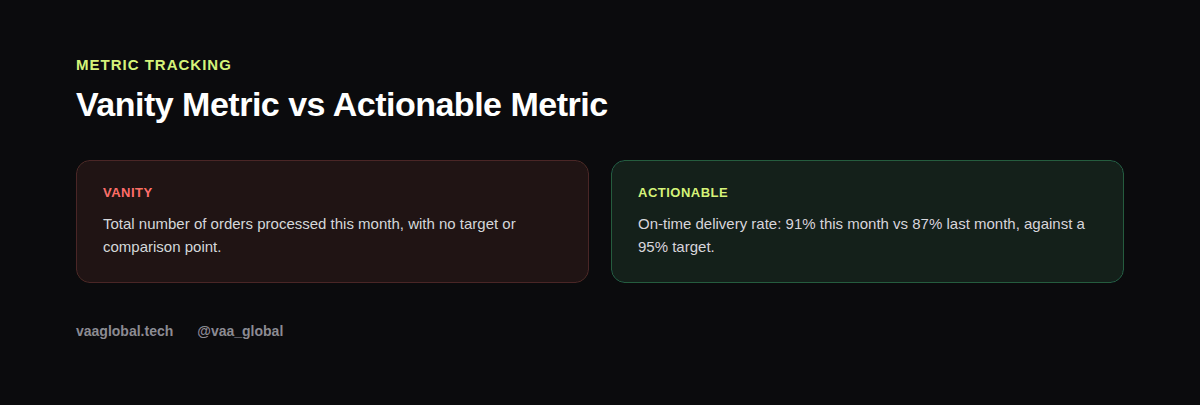
Every metric needs a benchmark, otherwise a number like "cycle time: 4 days" tells you nothing on its own. Compare against your own historical throughput, an industry benchmark where one exists, or a target leadership has agreed to. How do you measure operations performance in a way that actually drives decisions? By pairing each raw number on your dashboard with a target and a trend line, so a glance tells you not just where you are, but whether you are moving in the right direction.
The Bottom Line
The key metrics every operations manager should track are not about collecting data for its own sake; they are about catching problems early and proving that your changes actually worked. Because a small, well-chosen set of metrics beats a sprawling dashboard nobody checks, start narrow, review consistently, and expand only once the basics are second nature.